Anthem Documents / Onboarding / Amplifier Dashboards
Player: Engagement
On this page, you will find a detailed breakdown of player cluster and bet volume across daily active players, session length, over time and per operator and game.
Useful for teams in: Product, Game Design, Marketing
Anything missing? Please let us know with this form.
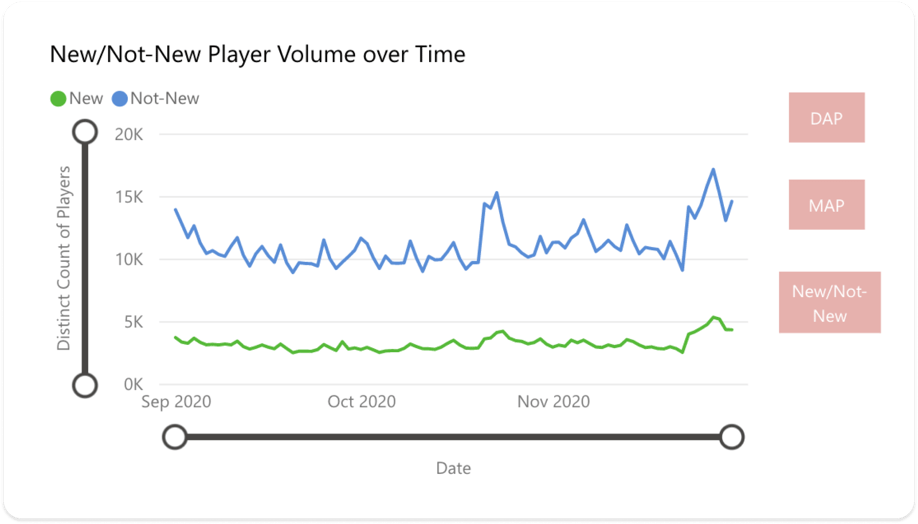
Daily Active Players (DAP)
A scrollable chart showing the number of DAPs over time across all 15 player clusters. This can also be segmented by Monthly Active Players and New/Not new players.
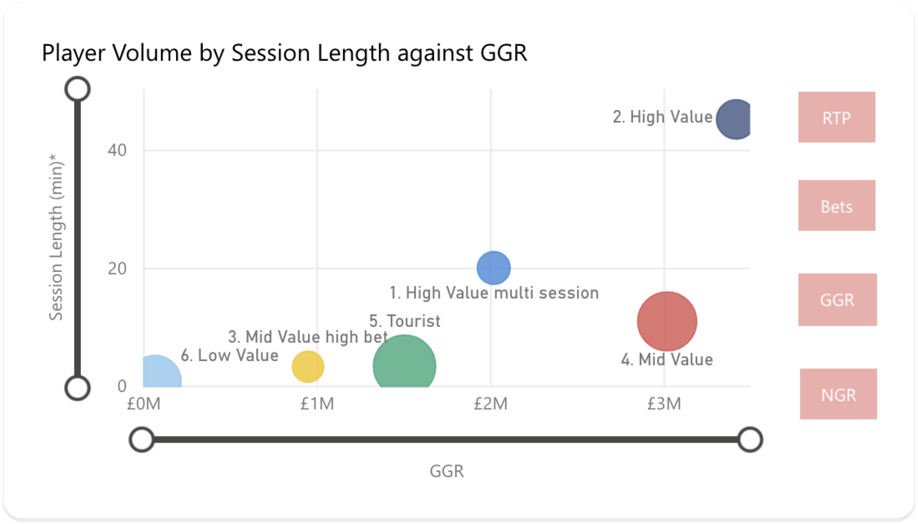
Player volume by session length against NGR
Dive deeper into several player engagement KPIs by correlating player session length with NGR plus GGR, RTP and bets.
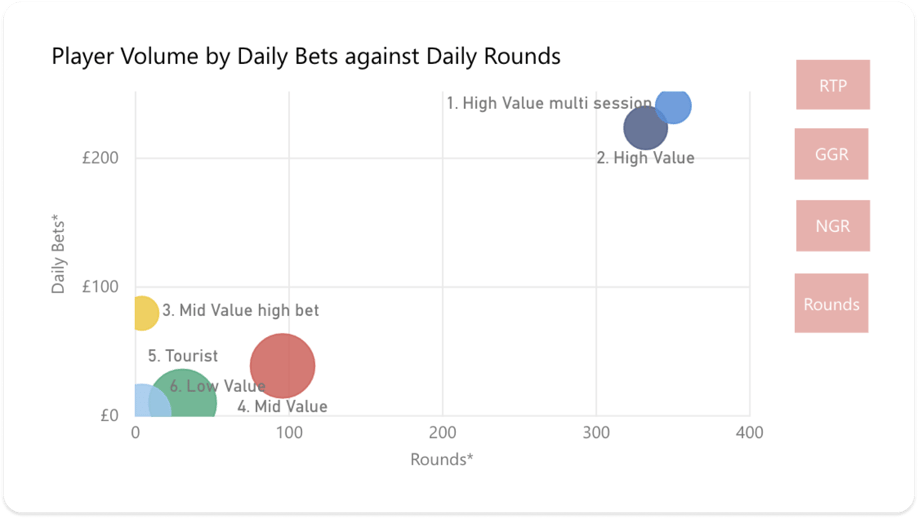
Player volume by daily bets against daily rounds
Compare daily bets versus the median number of spins or rounds.
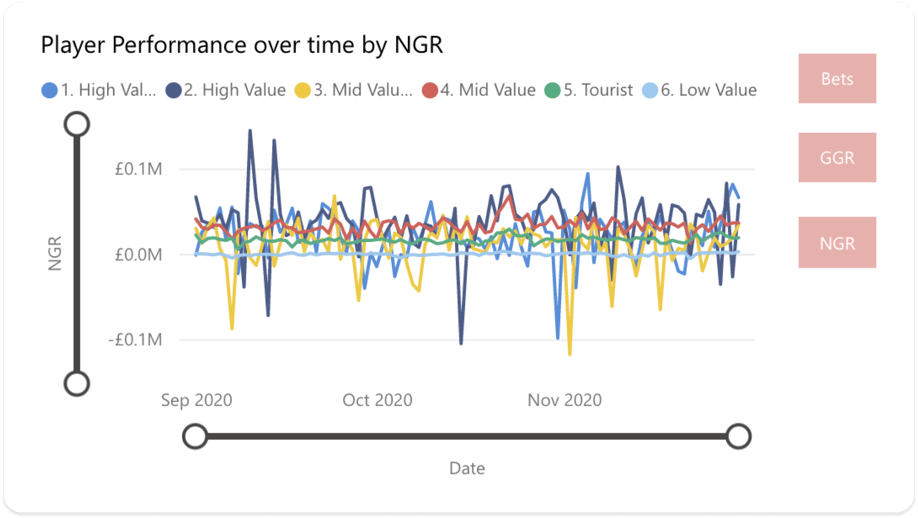
Player Performance over time by bets
Analyse player cluster performance over time by bets, GGR and NGR with the ability to segment by game and operator.
What to read next?