Anthem Documents / Onboarding / Amplifier Dashboards
Player: Identity
On this page you will find a detailed analysis of your player clusters and how they behave across various KPIs, including bet distribution by game, revenue per bet per cluster, largest wins and across geographies.
Useful for teams in: Product, Game Design, Commercial, Marketing
Anything missing? Please let us know with this form.
Player clusters
Review all your major player profiles at a glance including high value multi session, high value, mid value, tourist, low value.
Find out how many spins high value, multi-session players play on average per day across multiple games compared to ‘Tourists’ or low value players who spin far less, opt for lower RTP games and shorter sessions.

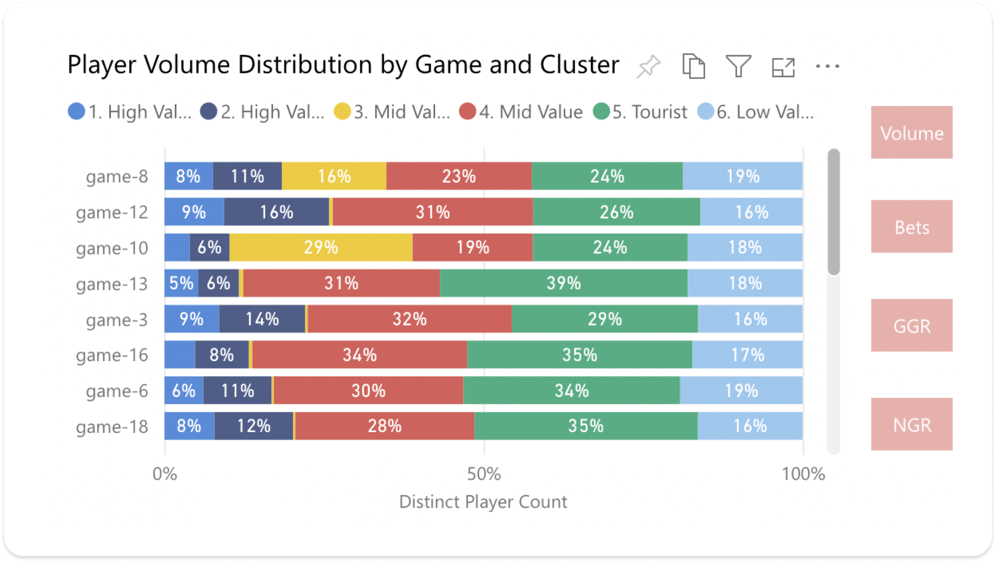
Player bets distribution by game and cluster
See player distribution data across multiple game titles with options to switch between different KPIs. This includes volume, bets, GGR and NGR.
You can alter the KPIs to see contribution of stakes per player segment.

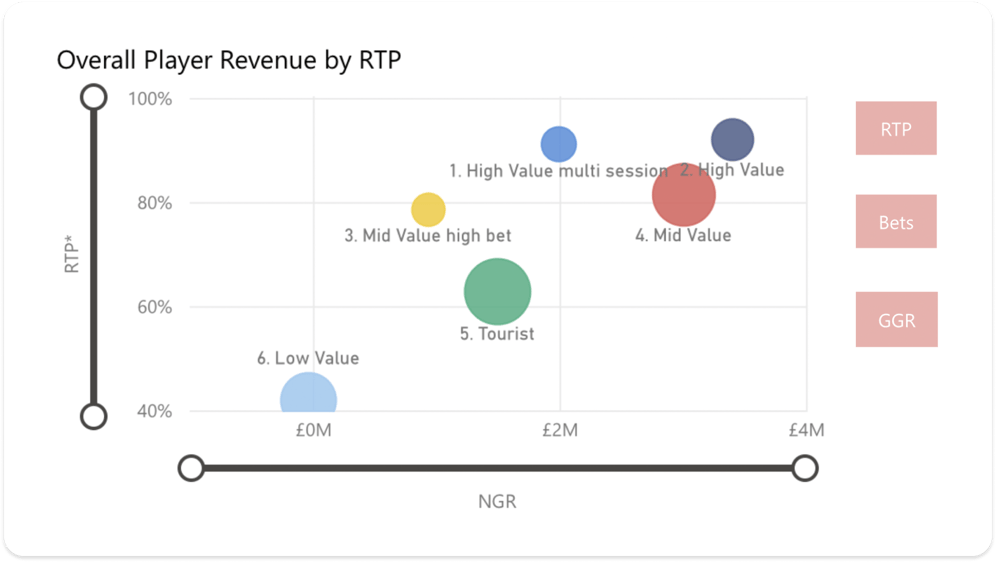
Overall player revenue by RTP
See which player clusters contribute the most across RTP, Bets and GGR.
Zoom into the cross axes to dive a little deeper.

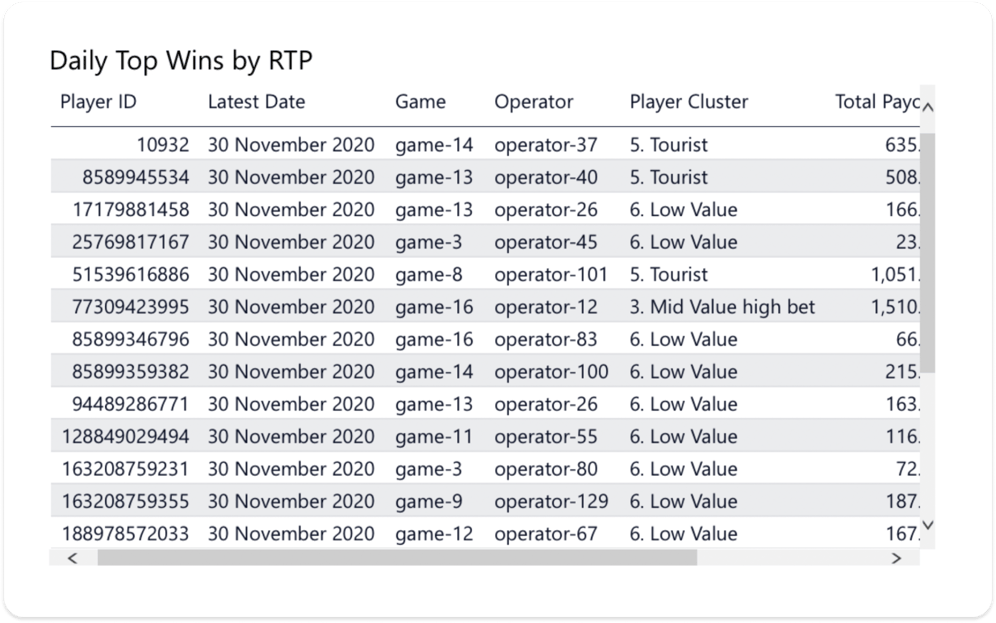
Daily top wins by RTP
Rank wins by RTP to identify the largest payouts across multiple categories including player ID number, date of win, game, player cluster, operator, total payout, stake and RTP percentage.
There is an optional slider tab to break this down further by individual operator, player cluster and game, while you can also compare operators.

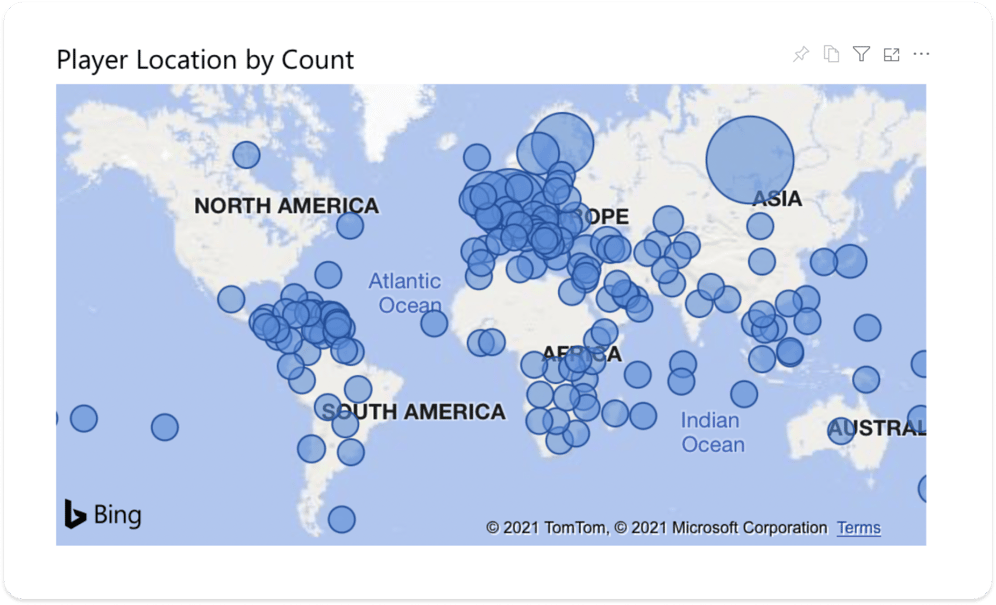
Player location by count
See a birds-eye-view of your player's location. The size of the circle reflects the number of players in a given area.
Zoom in by scrolling on your mouse.

